Dog Gets Covered in Sawdust
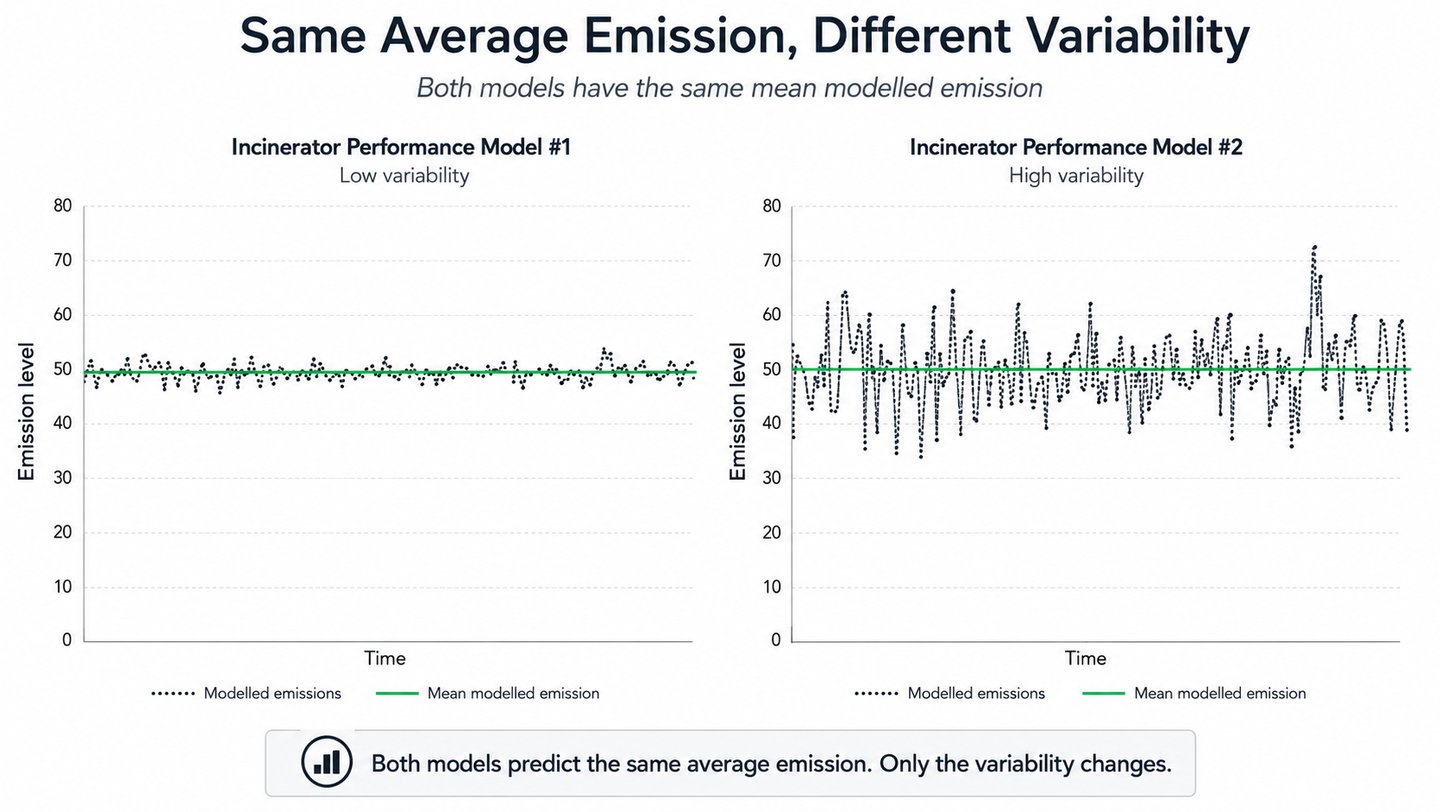
A model can correctly predict average performance but in real life averages are only part of the story. Variability matters.
Scott Dunham
7/15/20268 min read
Tom found Bill under the mango tree with Dog asleep beside his chair and two charts spread across his lap.
“Which incinerator would you rather live next to?” Tom asked.
Bill looked at the first chart, then the second.
“The first one.”
“You haven’t studied them.”
“Didn’t need to.”
“They have exactly the same average emissions.”
Bill looked again.
The first line stayed fairly close to the average.
The second bucked up and down like a trailer on the Blackbutt Range.
Bill nodded.
“Two blokes can both average two beers a day. One has two each evening. The other has fourteen on Saturday and spends Sunday apologising to a wheelie bin.”
Dog lifted his head at the word bin.
“The average isn’t the whole story,” Bill said.
“That’s the point.”
“Good. Saves time.”
Tom handed him the charts.
“The first model says the incinerator behaves steadily. The second says it has much bigger highs and lows.”
“But they both produce the same amount overall.”
“Yes.”
“So the average has hidden the interesting bit.”
“Yes.”
Bill gave the charts back.
“And you reckon the model might have ironed the bumps out?”
“That’s the concern. Models usually simplify the
real highs and lows. The predicted line often sits
closer to the average than the real operation does.”
“So the machine might not be steady.”
“No.”
“It might just have a steady model.”
“Exactly.”
Bill stood up.
“Bring me those two buckets.”
Tom looked towards the shed.
“Why?”
“Atmospheric science.”
“That sentence worries me.”
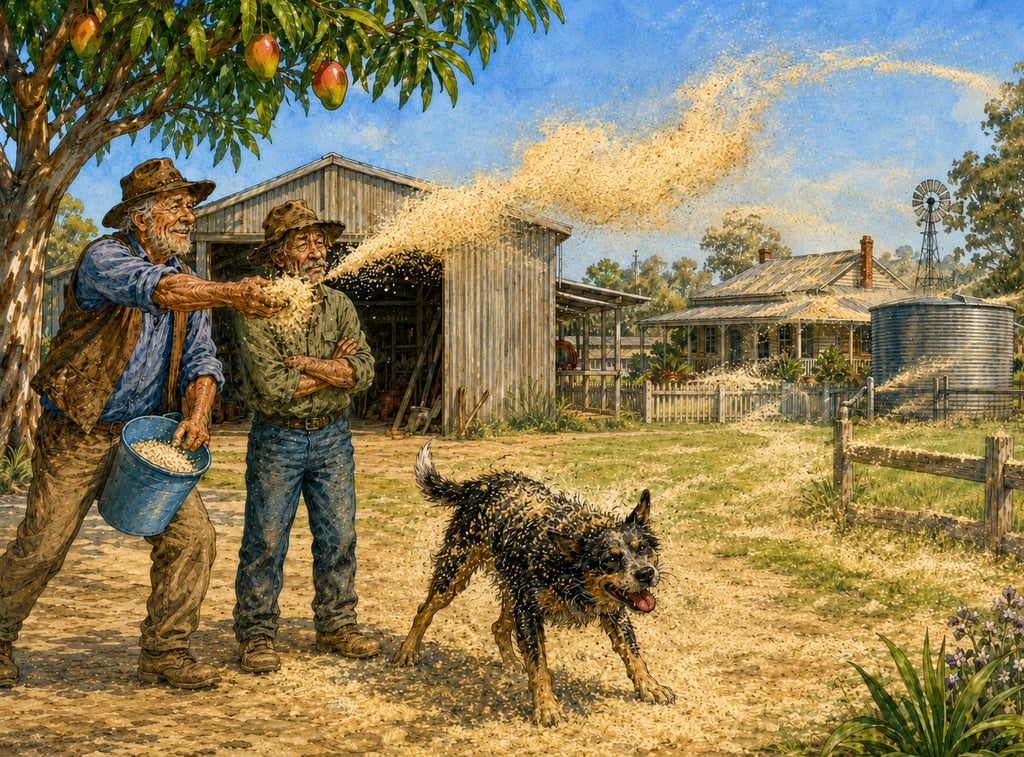
The buckets were beside the workbench. Bill filled both with the same amount of fine sawdust.
Dog followed closely. Dog believed all buckets were potentially food-related until proven otherwise.
Bill carried the first bucket into the yard.
Dog sat nearby to supervise.
Bill began feeding the sawdust into the air slowly and steadily.
The wind wandered around as he worked. Some sawdust drifted towards the fence. Some went towards the shed. Some settled in the grass.
Because Bill released it at roughly the same rate throughout, it fell as a light, fairly even covering across one part of the yard.
Dog watched the whole performance from a safe distance.
“There,” Bill said. “First incinerator.”
“Steady release,” Tom said.
“Very respectable.”
Dog sniffed the air, found no evidence of lunch and lay down again.
Bill picked up the second bucket.
This time, instead of letting the sawdust trickle through his fingers, he waited and threw it out in large handfuls.
The first burst caught the wind and sailed towards the tank stand.
Dog stood up.
The wind shifted.
Bill threw another handful.
That one went towards the fence, curled past the shed and scattered through the grass.
Dog took two steps sideways.
Another gust came through.
Bill tossed a third handful.
The sawdust rose, spread wide and came straight back across the yard.
Dog vanished inside a pale yellow cloud.
There was a brief silence.
Then Dog erupted from it, sneezing, shaking his head and looking personally betrayed.
He ran towards the shed, changed direction at the wheelbarrow and distributed the sawdust across several places Bill had missed.
By the time the bucket was empty, sawdust lay across the grass, the fence, the shed roof, the tank stand and most of Dog.
Tom looked around.
“Same amount.”
“Same bucket,” Bill said.
“But a much wider spread.”
“Different release.”
Dog shook himself.
A fresh cloud settled over Tom’s boots.
“And greater community participation,” Bill added.
Tom brushed sawdust from his trousers.
“The wind moved around during both demonstrations.”
“It tends to.”
“So the difference wasn’t the weather.”
“No.”
“It was what you did with the bucket.”
Bill looked at Dog.
“And who was unlucky enough to be standing downwind.”
Dog sneezed.
Tom retrieved the charts.
“That’s what the average doesn’t show.”
Bill pointed at the first one.
“This model tells the plume model the incinerator releases pollution steadily.”
“Yes.”
“So the plume model gets the neat version.”
“More or less.”
Bill pointed at the second.
“And this one says the stack sometimes releases much larger amounts.”
“Yes.”
“Which means those larger releases go out under whatever wind happens to be blowing at the time.”
“Yes.”
“Towards different places.”
“Yes.”
Bill pointed towards the paddock.
“Grass.”
Then the house.
“Roof.”
Then the tank.
“Water.”
Then Dog.
“Victim.”
Dog stared at him.
“The total amount can be the same,” Tom said, “but the pattern on the ground can be very different.”
“Same bucket.”
“Different footprint.”
Bill looked towards the tank.
“People in town turn on a tap and assume someone else has worried about what fell into it.”
“Out here, whatever lands on the roof may wash into the tank.”
Bill nodded.
“That does make the roof more than a roof.”
Dog moved farther from the buckets.
“A quick learner,” Bill said.
Tom put the two charts on the table.
“The Glan Devon air-quality assessment changes the weather through time.”
“As it should.”
“But within each operating case, the stack emissions appear to stay constant.”
Bill frowned.
“Constant normal?”
“Yes.”
“Constant worst case?”
“Yes.”
“So the wind behaves like weather, but the incinerator behaves like a tap.”
“That’s about it.”
“And a real waste burner?”
“That’s the question.”
Bill looked back across the yard.
“A real one gets different material, different moisture, different fuel and the occasional Friday afternoon.”
“Yes.”
“But the model keeps Bill’s hand steady.”
“Yes.”
“And never throws the bucketful that covers Dog.”
“Not within either run.”
Dog appeared satisfied that the investigation had finally identified the responsible party.
Bill sat back down.
“So ‘normal’ might be a tidy version of normal.”
“Yes.”
“And ‘worst case’ might just be a larger tidy version.”
“Possibly.”
“Still tidy, though.”
“Yes.”
“That seems worth mentioning.”
Tom gathered the charts.
“The real question is whether those constant stack emissions properly represent the plant.”
Bill nodded.
“Did they model the machine?”
“That’s what we need to establish.”
“Or did they model a nice steady number?”
Dog walked over and shook himself beside the table.
Sawdust settled across both charts.
Bill looked down at them.
“Same average,” he said.
“Different variability,” Tom said.
Dog sneezed.
Bill brushed sawdust from the paper and looked at Dog’s pale yellow coat.
“And if the model says Dog stays clean while Dog’s standing there covered in sawdust”
Tom waited.
Bill handed back the charts.
“you haven’t modelled the yard. You’ve modelled the bucket.”
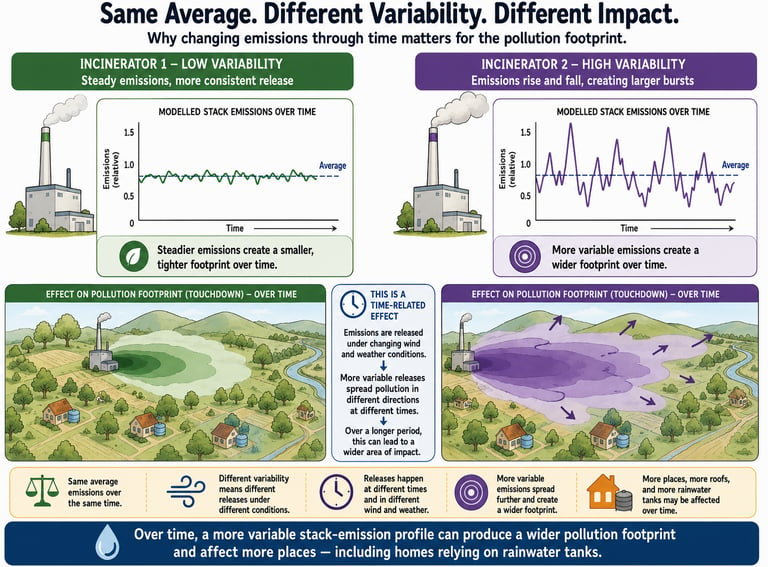
Models Don't Just Predict Averages
They Predict Behaviour
If you've already read Bill, Tom and Dog throwing buckets of sawdust around the paddock, you've already met the idea behind this article.
Bill used exactly the same amount of sawdust in both buckets.
The only thing he changed was how it was released.
One bucket was tipped out slowly and steadily.
The other was thrown into the air in bursts while the wind changed.
Same bucket.
Same total amount.
Very different footprint.
That simple little story illustrates an important question about the air-quality modelling for the proposed Glan Devon biosolids facility.
Two incinerators. Same average. Different behaviour.
Imagine there are two waste incinerators.
Both produce exactly the same average emissions over a year.
If we looked only at the averages, we'd conclude they were essentially identical.
But they're not.
One operates quite steadily.
The other produces much larger highs and lows.
The average is the same.
The behaviour is different.
That difference matters because the emissions leaving the stack become the input to another model that predicts where pollution travels and where it lands.
The plume model doesn't just need to know how much pollution leaves the stack.
It also matters when it leaves the stack.
Why timing matters
The atmosphere isn't constant.
The wind changes.
The temperature changes.
The air becomes more or less turbulent.
Sometimes pollutants rise and disperse.
Sometimes they stay close to the ground.
If emissions occur steadily, they are released into many different weather conditions in roughly equal amounts.
If emissions occur in bursts, those bursts may happen when the wind is blowing towards one group of houses, then another, then across someone's rainwater tank.
Over months or years, the same total amount of pollution can produce a very different pattern on the ground.
Exactly like Bill's sawdust.
Same bucket.
Different footprint.
Models simplify reality
Every model simplifies reality.
That's not a criticism.
It's what models do.
The important question is what has been simplified?
A real waste-processing plant will not behave exactly the same way every hour.
The biosolids will change.
The waste fuel will change.
Moisture will change.
Feed rates will change.
There will be startup and shutdown.
Maintenance.
Equipment problems.
Short-term disturbances.
All of these can affect stack emissions.
The modelling method has to convert that changing operation into something the plume model can use.
How it does that matters.
What the Glan Devon assessment appears to do
Reading Appendix H, Part 2, the air-dispersion model appears to use two operating scenarios.
One represents normal operation.
The other represents worst-case operation.
Within each scenario, however, the stack emissions appear to be treated as constant.
The report provides one emission rate for each pollutant under the normal scenario and another emission rate under the worst-case scenario.
Those fixed emission rates are then modelled continuously while the weather changes hour by hour.
In other words:
The model changes the weather through time, but it does not appear to change the stack emissions through time.
That is an important distinction.
Why that may matter
Imagine Bill's sawdust again.
Instead of throwing it in bursts while the wind changes, imagine he lets it trickle out continuously all afternoon.
The total amount of sawdust is exactly the same.
But the footprint is different.
The same principle may apply here.
A model using constant stack emissions is effectively telling the plume model:
"The incinerator behaves steadily."
A real plant may not.
If the real stack occasionally produces larger emission pulses, those pulses will occur under whatever weather exists at that moment.
Over time they may reach different places and create a wider area of impact than a constant-emission model predicts.
That doesn't prove the submitted plume is too small.
But it does raise an important question:
Does a constant-emission model adequately represent a variable real-world incinerator?
This is not about the average
The average emissions could still be correct.
That's not the issue.
The issue is whether the modelling captures enough of the plant's real behaviour to predict where pollution actually goes.
If the model smooths out too much of the variation, it may also smooth out part of the resulting pollution footprint.
The average may stay the same.
The footprint may not.
The questions that matter
This leads to some straightforward questions.
• What operating data were used to derive the stack emissions?
• Were they measured from a plant using the same technology and the same types of biosolids and waste fuel?
• Do they represent startup, shutdown and abnormal operation?
• Why were constant emission rates used within each scenario?
• Were any time-varying emission profiles tested?
• How sensitive is the predicted plume to changes in stack emissions through time?
Those are not mathematical questions.
They are questions about whether the model represents the real operation.
Why this matters
The plume model is one step in a chain.
Stack emissions become plume predictions.
Plume predictions become estimates of where pollutants such as PFAS and heavy metals may travel and where they may fall.
Those predictions then become part of the evidence used to decide whether the proposal is acceptable.
The better the stack model represents reality, the more confidence we can have in everything that follows.
Bill's two buckets of sawdust remind us of something surprisingly simple.
Sometimes how something is released matters just as much as how much is released.
That is a question worth asking before any planning decision is made.
© 2026. All rights reserved.