The average biscuit and the pips
What do a school biscuit sale and a waste-burning incinerator have in common? They can give you the pips if you don't understand variability
Scott Dunham
7/16/20267 min read


Bill and Tom were sitting at the table with two plates of plum-jam biscuits between them.
Dog was underneath, positioned with the quiet confidence of an animal who understood that quality control produced rejects.
Bill’s missus put down three mugs of tea and looked at the two men.
“You can have one from each plate.”
Tom reached for the nearer one.
“One,” she repeated.
“I’m comparing the batches.”
“You’re eating biscuits.”
“Comparison requires data.”
“It requires you to leave enough for the school fete.”
Tom took one from each pile and examined them.
They looked much the same: golden biscuit, thumbprint of homemade plum jam, light dusting of sugar.
“What are we comparing?” Bill asked.
“The jam had a few pip fragments in it,” she said. “Not many, but enough that I wouldn’t send a biscuit out if it had more than one hard bit in it.”
Bill nodded. Nobody wanted the school fete remembered for dental work.
“The first batch was mixed properly,” she continued. “The second was Tom’s.”
“I followed the recipe.”
“You stirred it twice.”
“Three times.”
“You stopped to listen to the cricket.”
“There was an appeal.”
“There was also a mixing bowl.”
Tom bit into the first biscuit. It was good: buttery, sharp plum jam, no unpleasant surprises.
Bill tried one from the same plate and nodded.
“Good biscuit.”
“I know,” she said.
They moved to the second plate.
Tom selected a clean-looking biscuit and ate it with the satisfaction of a man expecting vindication.
“Perfect.”
Bill took another. Also perfect.
“There you go,” Tom said. “My method works.”
Dog’s nose appeared beside Bill’s knee.
Bill broke off a corner and dropped it.
Dog swallowed it without chewing, which weakened his value as a food critic but not his enthusiasm.
Tom reached for another biscuit.
This one made a small but distinct crack when he bit down.
He stopped chewing.
Bill looked across the table.
“Good?”
Tom removed three plum-pip fragments from his mouth and placed them carefully on the saucer.
“Bit concentrated.”
“Must be the statistical biscuit.”
Bill’s missus took the plate and began checking the rest. The next four were clean. The fifth had two hard fragments in the jam. The sixth had none. The seventh appeared to contain the better part of a plum stone.
She put it aside.
Tom watched the rejected pile grow.
“There can’t be any more pips in this batch than the first one. We used the same jar of jam.”
“Same number,” she said. “Different mixing.”
“So the average contamination is the same.”
Bill picked up another biscuit.
“Comforting.”
“It is relevant.”
Bill bit down, paused, and removed a pip from his biscuit.
“Not as relevant as this one.”
Tom pulled the kitchen scales closer and began counting biscuits and pip fragments. After several minutes, assisted by Bill and hindered by Dog, he sat back.
“I was right. Both batches average just under one pip fragment per biscuit.”
Bill’s missus looked at the rejected pile from the first plate. There were none.
Then she looked at the second. Nearly a quarter of Tom’s biscuits had more than one hard fragment and would not be going anywhere near the fete.
“Same average,” Tom said.
“Different number of crook biscuits,” Bill replied.
“The clean ones balance the bad ones.”
“On your bit of paper.”
“Mathematically, yes.”
Bill pushed the biscuit with the plum-stone excavation towards him.
“Have another balanced one.”
Tom declined.
Dog, sensing opportunity, stood and placed his chin on Tom’s knee.
“You can’t feed those to him,” Bill’s missus said. “He’ll swallow the pips.”
Dog looked offended by the suggestion that this differed from his normal approach to food.
Tom studied the two plates. In the first batch, the contamination had been spread thinly and consistently. No biscuit crossed the household limit.
In his batch, most biscuits had no pips at all. They were cleaner than the average. Unfortunately, that left the remaining pips crowded into a smaller number of biscuits, some of which were now better suited to road base.
“The average doesn’t tell us how the pips are distributed,” he said.
Bill took a sip of tea.
“Getting there.”
“And once we set a limit for each biscuit, the distribution decides how many fail.”
“There he is.”
Tom looked at the rejected pile again.
“The clean biscuits pull the average down, but they don’t make the bad biscuits acceptable.”
“Nor uncrack your tooth.”
Bill’s missus began opening the packets she had already prepared from Tom’s batch.
“What are you doing?” Tom asked.
“Checking every biscuit.”
“We’ve already sampled them.”
“Yes. That went well.”
She found another bad one in the first packet and two in the next. The biscuits came back out, the bags had to be replaced, and the kitchen table slowly disappeared beneath crumbs, paper and Tom’s declining confidence.
“If these had gone to the fete,” she said, “I’d have complaints, refunds and people checking every batch I made after this.”
“But the average contamination met the estimate.”
She gave him the sort of look that had settled many domestic arguments before they reached the modelling stage.
“I don’t sell an average biscuit, Tom.”
Bill nodded towards the packets.
“You got the average number of pips right. You got the number of crook biscuits wrong.”
“And that changes the cost,” Tom said.
“More rejects, more checking, more work and fewer biscuits to sell.”
Dog quietly lifted one of the rejected biscuits from the edge of the table.
There was a crunch.
Dog stopped, spat out a plum stone and looked accusingly at Tom.
Bill picked it up.
“Complaint received.”
Tom reached for his spreadsheet.
Bill’s missus reached for the plates.
“No more modelling.”
“I was only going to adjust the variability.”
“You can adjust it after you finish checking the other six dozen.”
Tom looked at the packets, the rejected pile and Dog, who had now moved his quality-control operation beneath Bill’s chair.
Bill handed him the first bag.
“Good news.”
“What?”
“On average, they’re excellent.”
Models, Part 2: When the Average Is Right but the Breaches Are Wrong
In the first article, Bill used two buckets of sawdust to show why the average amount released does not necessarily tell us where that material will end up.
This time, we use the same two modelled incinerators but add a regulatory emission limit.
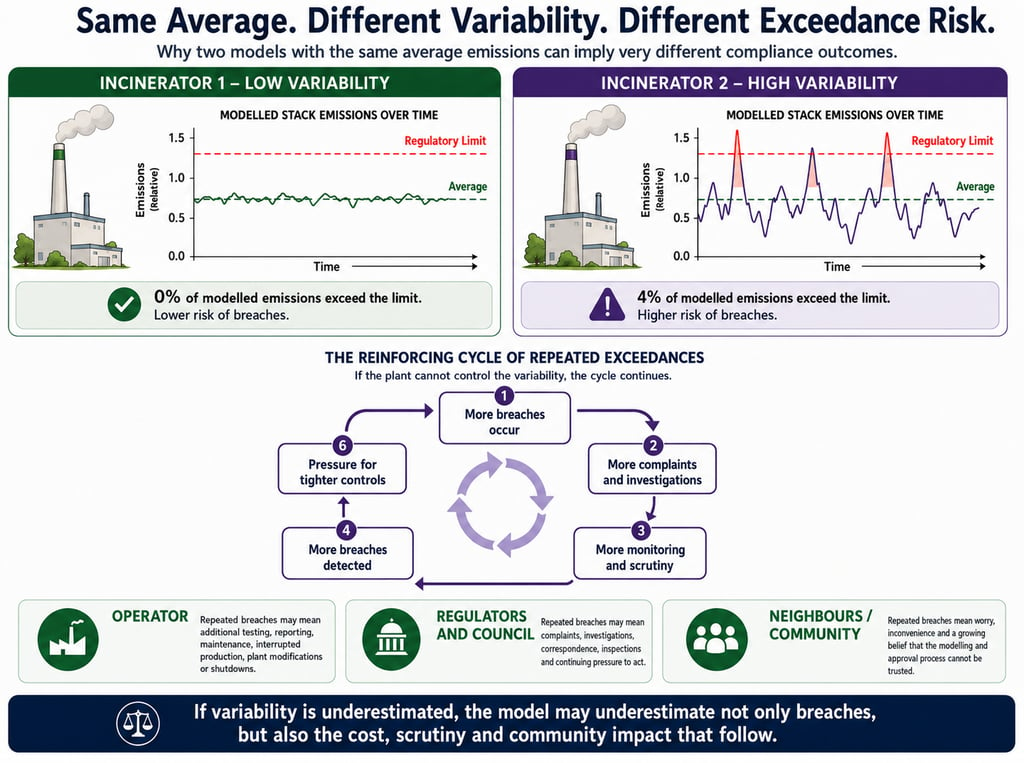
Both models predict exactly the same average emissions. The first has low variability, with results staying close to the average. The second has much greater variability, with more low results and more high results.
If we only report the average, the two plants look identical. They are not.
An average tells us where the middle of the results lies. It does not tell us how widely those results are spread around that middle.
Models make reality look tidier
Real operating data contain peaks, troughs, disturbances and unusual events. Models generally try to identify the underlying pattern, and in doing so they usually smooth some of that variability away.
That may not matter much if the only question is the long-term average. It matters greatly once we add a regulatory limit.
In our example, the low-variability model predicts no breaches. The higher-variability model has exactly the same average, but breaches the limit during 4% of the modelled periods.
That 4% is only an illustration. It is not a prediction for Glan Devon.
The lesson is that a model can estimate the average correctly while still underestimating the number of breaches because it makes the plant appear steadier than it really is.
Breaches have consequences
Repeated breaches are not merely marks on a graph. They can mean additional testing, investigations, maintenance, interrupted production, complaints, regulatory work and declining community confidence.
These effects can reinforce one another. More breaches lead to more complaints and monitoring. More monitoring may identify further breaches. That creates more concern, less trust and pressure for tighter controls.
The proper response should be better process control and fewer breaches. But that assumes the technology can control the causes of the variability. For a proposed plant burning changing waste material, that should be demonstrated before approval.
What do real incinerators do?
Operating waste incinerators do not normally produce perfectly constant stack emissions. Their performance changes as the waste changes and as the plant moves through startup, shutdown, stable operation and disturbance.
Studies and regulatory guidance dealing with municipal and other waste incinerators show that emissions can vary materially with changing feed composition and operating conditions.
These are not Xetrov furnaces, so they do not prove that Xetrov will behave in exactly the same way. They do establish the general principle: waste-incinerator emissions are variable because the fuel and the process are variable.
If Xetrov controls that variability unusually well, there should be operating evidence showing it.
Where is the Xetrov evidence?
There is no publicly available, independently verifiable operating history showing how a commercial Xetrov unit performs over time while processing a variable non-recyclable waste feed.
The Pollington pilot is reported by East Riding Council to be mothballed. A Daventry installation has been claimed publicly, but I have found no verifiable evidence showing that it became a commercial-scale operation with a published operating record.
There is also no public Xetrov time series showing the normal range of emissions, the frequency of high-emission periods or how the plant responds when the waste feed changes.
What the applicant’s report says
Appendix H, Part 2 explains that the emissions data used for Glan Devon came from a trial operating at about 70% capacity and burning polyurethane dust. Those results were multiplied by 1.42 to estimate full-capacity emissions.
Multiplying the result makes the number larger. It does not create the missing variability.
The assessment then appears to use one fixed emission rate for each pollutant in the normal case and another fixed rate in the stated worst-case case. The weather changes through time, but the stack source remains constant within each model run.
The result is two tidy versions of the plant: one always normal and one always worst case. Neither shows how the plant may move between lower, normal and higher emissions.
That matters because the proposed NRW feed is unlikely to be uniform. Plastics, additives, treated timber, coatings, moisture and contaminants may all vary. The plant response may vary as well.
Sampling the incoming feed may help, but it cannot fully answer the question. Mixed waste is difficult to sample representatively, and stack emissions depend on both what enters the furnace and how the furnace responds.
The Glan Devon assessment shows what CALPUFF predicts from two selected constant emission rates.
It does not establish the real distribution of Xetrov emissions.
The average may be right.
The number of breaches may not be.
© 2026. All rights reserved.